Deep Learning-Based Diabetic Retinopathy Detection in Fundus Images

This blog post is based on a group project completed in the “Deep Learning” class at Yale University under the guidance of Professor Smita Krishnaswamy. The project was a collaborative effort with Alaa Alashi, Taieb Bennani, and Xinyue Qie.
Diabetic retinopathy (DR) affects over 103 million people with diabetes globally, a figure predicted to reach 125 million by 2030. Untreated DR can lead to retinal detachment, neovascular glaucoma, diabetic macular edema (DME), and vision loss. Clinicians diagnose it from fundus photographs, looking in particular for hemorrhages and exudates.
We tested whether deep learning could detect and quantify those signs in high-resolution fundus images from a specialized rural ophthalmic clinic in Morocco. The project combined binary classification of DR presence with image segmentation of hemorrhages and exudates. This setting matters because developing countries have fewer doctors per capita than developed nations.
Clinical context and dataset
Images are de-identified and used for educational purposes with appropriate permissions.
The retina converts light into neural signals. DR develops when sustained high blood sugar damages its small capillaries, which may then leak blood and fluid. Hemorrhages appear as small dark red or maroon spots in fundus images; exudates are yellowish-white deposits of lipids and proteins. Their presence helps clinicians assess disease severity and progression.
Our dataset comprised 126 high-resolution, de-identified images: 95 labeled as DR and 31 as non-DR. The imbalance reflects the source, a specialized ophthalmic surgery clinic where patients with existing DR are more common. All images came from the same screening technology.
We removed screening-equipment parameters from image corners and resized the images to uniform dimensions (256×256 pixels by default, with hyperparameter variations).
Binary classification with ResNet
Problem formulation
Let represent our preprocessed input fundus images, and let denote the DR status for each sample, where if sample has DR and otherwise. We develop a binary classification algorithm aimed at accurately classifying whether a patient has DR from the input fundus images.
We used a pre-trained 50-layer ResNet from torchvision. Its residual connections help gradients pass through a deep network during training.
Handling class imbalance
The dataset contained 31 non-DR images and 95 DR images, so we compared two balancing strategies.
Approach 1: Oversampling We oversampled the non-DR images in the training dataset with replacement to create a balanced training dataset with equal numbers of DR and non-DR images.
Approach 2: Weighted Cross-Entropy Loss We applied a weighted cross-entropy loss function to penalize false classification of non-DR images. The standard cross-entropy loss is:
For the weighted version, we assign different weights to misclassified non-DR images compared to misclassified DR images. With , our loss function becomes:
We experimented with to find the optimal balance.
Hyperparameter tuning and results
We ran a grid search over learning rate ( to ), batch size (8, 16), optimizer (SGD, Adam), momentum (0.9 for SGD), and balancing strategy (none, oversampling, weighted loss). We measured accuracy, precision, recall, and F1-score on training and test sets.
The best results were obtained using a learning rate of , a batch size of , oversampling the underrepresented non-DR class in the training dataset, and the SGD optimizer. This configuration achieved:
- Testing precision: 0.967
- Testing recall: 0.935
- Testing accuracy: 0.921
Almost all configurations produced high testing recall, with 10 out of 18 experiments achieving a testing recall above 0.9. The oversampling method achieved the highest testing precision, while the weighted cross-entropy improved testing recall. The SGD optimizer generally outperformed the Adam optimizer for the default hyperparameter configurations. Training converged after 35 epochs, indicating stable learning.
Image segmentation with U-Net
Architecture and motivation
The second phase segmented hemorrhages and exudates. Quantifying them can help assess retinopathy severity and inform treatment.
U-Net is a convolutional neural network for semantic segmentation. Its encoder-decoder architecture produces a per-pixel mask:
- Encoder: A series of convolutional blocks, each followed by a max-pooling layer, systematically reducing spatial dimensions while increasing depth to learn hierarchical features
- Bottleneck: A convolutional block connecting encoder and decoder, enabling learning of abstract high-level features
- Decoder: Reconstructs the segmentation mask by progressively upscaling feature maps using up-sampling layers, combining up-sampled features with corresponding encoder features via skip connections (concatenation)
- Output layer: Employs softmax activation to produce per-pixel class probabilities, resulting in a segmentation mask where each pixel is assigned to one of the classes (exudates, hemorrhages, or background)
We added L2 regularization to prevent overfitting.
Data labeling and processing
We used the VGG Image Annotator software to label DR images accurately, creating a custom region attribute called “Abnormality” with a dropdown menu to differentiate between hemorrhages and exudates. With the assistance of a retinal specialist, we labeled 76 DR images. We used rectangles to label the images, though polygons would have been more accurate given the oval shapes of hemorrhages and exudates.
After labeling, we exported a CSV file containing positions of each hemorrhage and exudate, including x and y coordinates and height and width of rectangles. We created ground truth masks with two channels—one for hemorrhages and one for exudates—serving as pixel-wise representations for training the U-Net model.
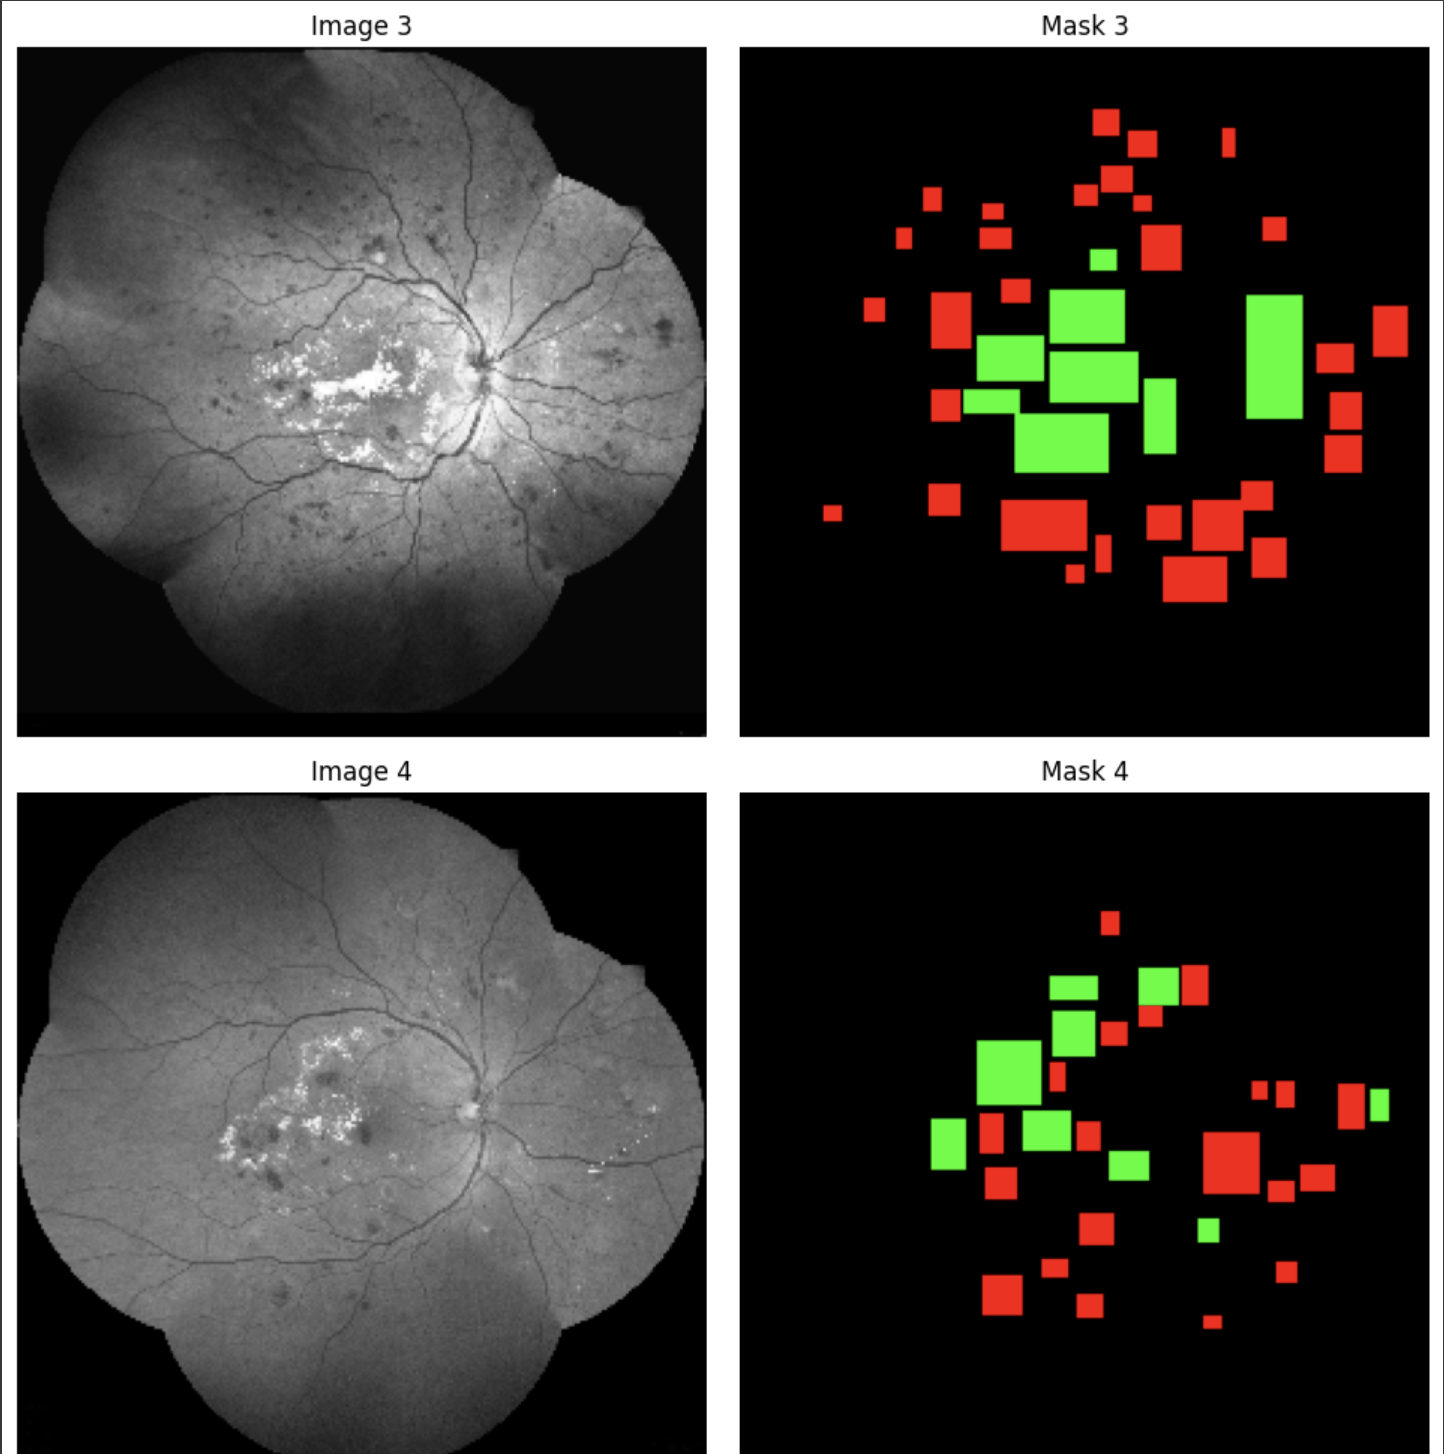
Data augmentation
With only 67 fundus images for segmentation, we used TensorFlow Keras ImageDataGenerator to augment the training data:
- rotation_range: Randomly rotate images up to 20 degrees
- width_shift_range and height_shift_range: Randomly shift images horizontally and vertically by 10% of their dimensions
- zoom_range: Randomly zoom in or out by up to 10%
- horizontal_flip and vertical_flip: Randomly flip images
- fill_mode: ‘nearest’ to fill empty pixels
Separate ImageDataGenerators were created for both images and their corresponding masks, synchronized with a common seed value to ensure augmentations applied to images match those applied to masks.
Hyperparameter tuning and results
We used the Keras Tuner library to search for optimal hyperparameter values during training. The search space included:
- Encoder filters: Ranges from [32, 128] to [128, 512] with step size 32
- Bottleneck filters: Range [256, 1024] with step size 64
- Decoder filters: Ranges from [128, 512] to [32, 128] with step size 32
- Learning rate: Floating-point values within [1e-4, 1e-2] sampled on a logarithmic scale
The model was trained with 50-100 epochs, batch size of 8, and a train/test/validation split of 70%/20%/10%.
We evaluated segmentation performance using key metrics:
-
Dice Coefficient: Measures similarity between predicted and ground truth segmentations, ranging from 0 (no overlap) to 1 (perfect match)
-
Mean Intersection over Union (IoU): Calculates the average ratio of intersection to union for each class
-
Accuracy: Proportion of correctly classified pixels
-
Recall: Proportion of correctly identified positive instances
Our segmentation model achieved:
- Accuracy: 0.9716
- Recall: 0.7220
- Jaccard Index (IoU): 0.4753
- Dice Coefficient: 0.6696
Accuracy was high, but the moderate recall and overlap metrics show the model’s limits. It detected hemorrhages more accurately than exudates, with recall and accuracy close to 1 for hemorrhages. Even specialists can mistake exudates for cotton wool spots or camera artifacts.
Limitations and next steps
The main limitation is data: 126 images for classification, 67 for segmentation, and a strong class imbalance. A follow-up should expand the dataset to around a thousand better-balanced images, especially by adding non-DR examples.
The rectangular annotations also include pixels outside the abnormalities. Polygons, ovals, or irregular shapes would fit their edges more closely, and ophthalmologists could provide more reliable labels for exudates. These changes would address the main limitations of the current project.