Strategic Model Selection in Cursor: Balancing Cost and Performance
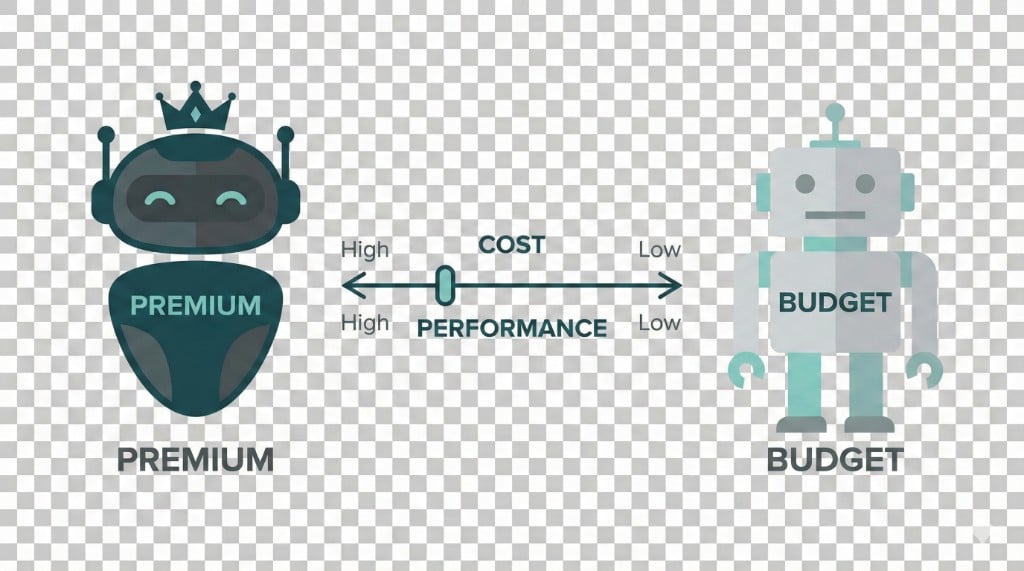
Checking Cursor’s pricing and a leaderboard back and forth is tedious; using “the best” model for everything can lead to surprisingly high bills. A simpler approach uses one stronger model for planning and one cheaper model for execution.
The two-model strategy
Planning (understanding the task and designing steps) benefits from strong reasoning. You send context and get back a plan and a few key decisions; token volume is modest, so the extra cost is often worth it.
Execution (implementing the plan and writing code) can be done well by cheaper models when the plan is clear. This phase uses many more tokens, so keeping cost per token low matters.
You avoid both the “everything on the best model” bill and the “everything on the cheapest” quality hit.
Why it works
Planning is input-heavy (lots of context in, compact plan out); execution is output-heavy (lots of code generated). Arena Code benchmarks show that mid-tier models are close to the top on code tasks at a fraction of the cost. Use strong reasoning where it matters and lower cost where most tokens are spent.
Cost vs performance at a glance
The chart below plots cost (weighted $/1M tokens: 70% input, 30% output) against benchmark performance. Data comes from Cursor’s pricing and public benchmarks; the workflow updates it daily.
Loading chart…
Lower left means cheaper and weaker; upper right means pricier and stronger. Pick a planning model from the upper right and an execution model from the lower half.
Token usage complicates the comparison
The charts above and the recommendations below use price per 1M tokens, but total cost also depends on how many tokens each model uses for the same request. Some models are more verbose or expand the context more aggressively; others stay more compact.
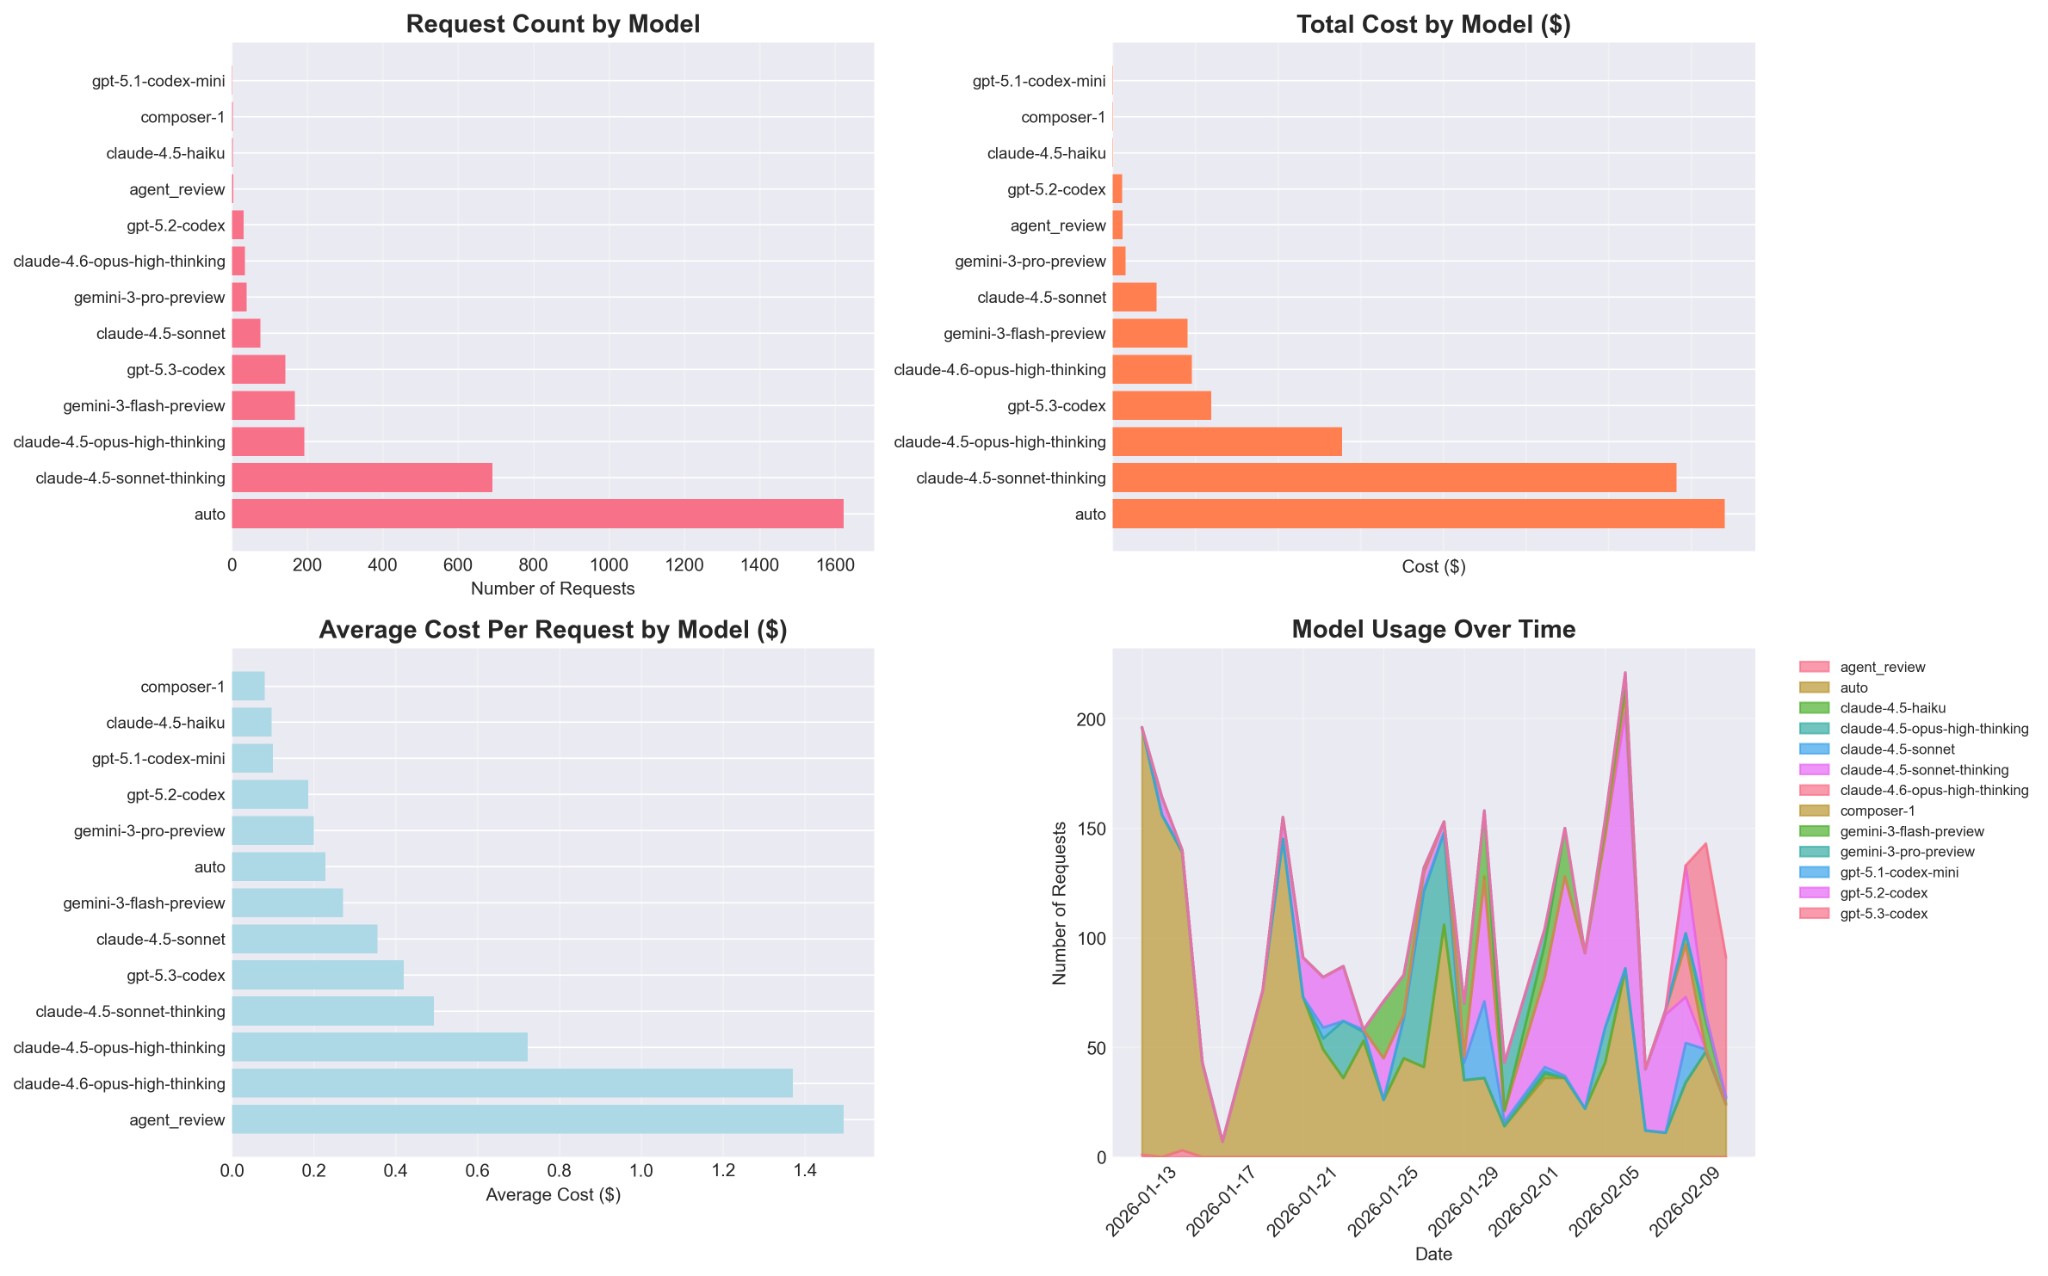
The figure above shows that request volume and spend are distributed very unevenly across models: “auto” and a few heavily used models dominate total cost even when their list price is modest.
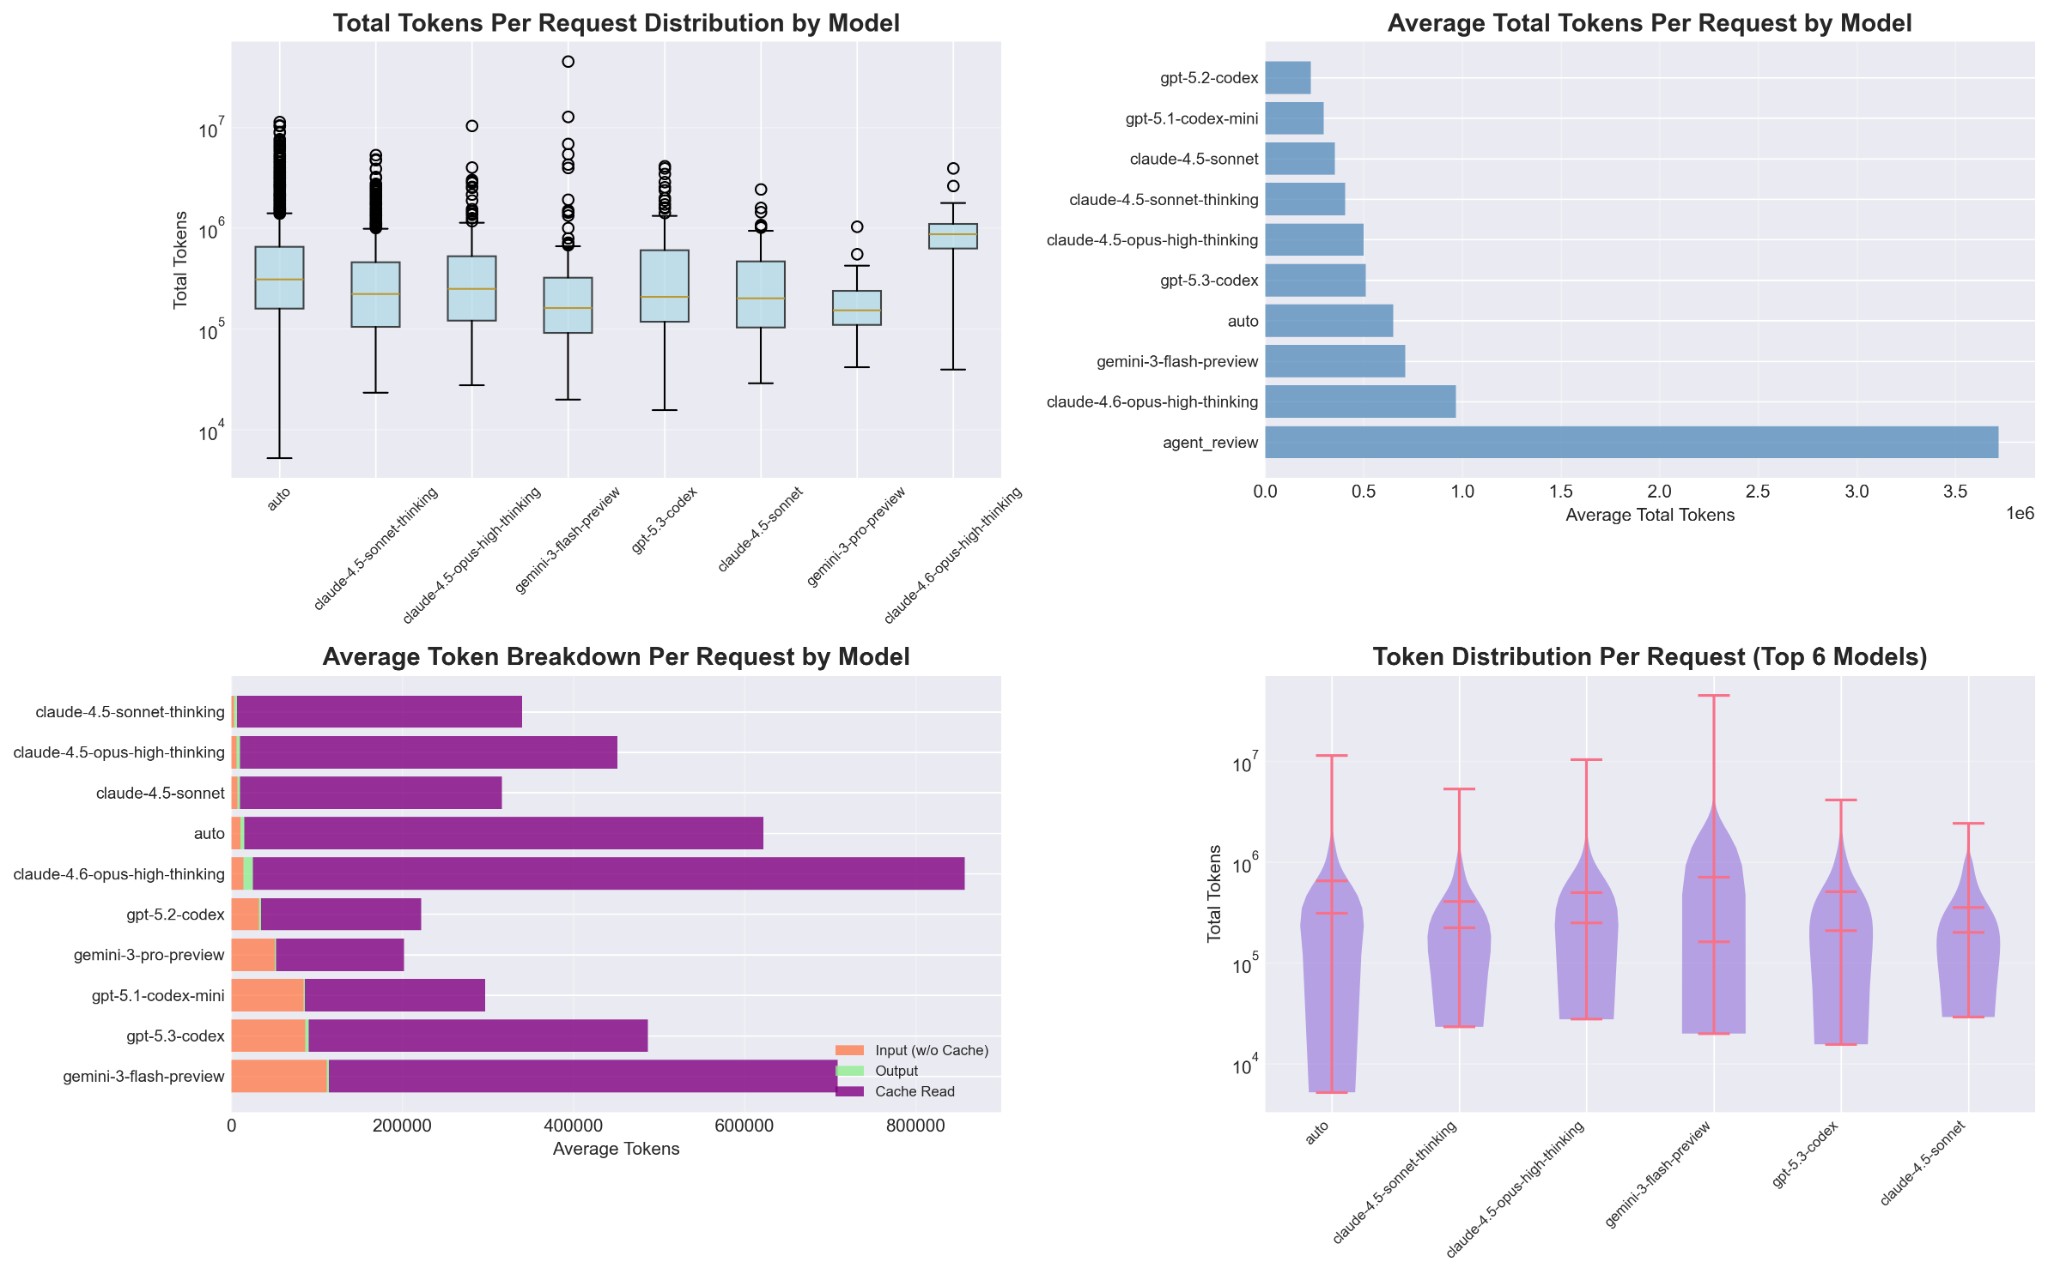
Total tokens per request can differ by orders of magnitude between models for similar tasks. When you experiment with alternative models, watch price per token and Elo alongside response length and context use; that combination is what shows up on your bill.
Recommended pairings
How the recommendations are selected
The chart shows Pareto frontiers as dashed lines (purple for planning, green for execution).
Mathematical formulation:
Step 1: Minimum performance threshold
Only models with Arena-Code or LMSYS Arena Elo scores qualify (no BigCodeBench-only models).
Step 2: Category criteria (not mutually exclusive)
Step 3: Pareto optimality (no dominated models)
Within each category, keep only Pareto-optimal models. A model qualifies only if no other model is both better-performing and cheaper, ensuring you never choose a strictly dominated option:
Step 4: Rank by efficiency and select top picks
Models are ranked by Elo per dollar. Select 4 models by efficiency per category (or fewer if frontier is smaller).
This keeps strictly dominated models out of the recommendations. The formula runs daily via GitHub Actions.
Example workflow
- Start with the planning model. Describe the goal, attach files, ask for a step-by-step plan.
- Lock in the plan. Review, maybe one short follow-up, then switch model.
- Switch to the execution model. Refer to the plan and implement step by step; do most coding here.
- Use the planning model only when needed. For design decisions or subtle bugs, switch back briefly, then return to the cheaper model.